


If you’ve ever found yourself staring down a 70+ slide research deck, you’re not alone.
You know the one. Every cut. Every segment. Every data point you might need, just in case someone asks.
As a researcher, it’s fascinating. It’s rigorous. It’s responsible. And it’s also… exhausting.
Hours disappear into formatting charts, aligning labels, resizing text boxes, and tweaking colors so the deck looks “polished enough” for stakeholders. Then comes the tailoring: one version for leadership, another for product, another for marketing, another for the client. Same data, different emphasis, slightly different story – over and over again.
And here’s the hard truth: most stakeholders will never consume your work the way you do.
Not because it isn’t good. But because they don’t have the time (or patience) to wade through everything.
The disconnect between research depth and stakeholder reality
Researchers are trained to explore. To look at the full distribution, the nuance, the edge cases. We want to understand everything before we make a claim.
Stakeholders, on the other hand, are trained to decide.
They’re juggling priorities, deadlines, and competing inputs. When they open a deck, they’re not asking to see every interesting angle in the data. They’re trying to quickly answer three questions: what matters most right now, what applies to them, and what they should do next.
When a deck tries to answer every possible question at once, it often answers none of them clearly. That’s why long decks so often lead to glazed eyes, rushed presentations, and insights that quietly fade away after the meeting.
The real problem isn’t the deck – it’s prioritization
It’s tempting to think the problem is formatting. Or tools. Or not having enough time.
But the real challenge is something deeper: prioritization.
Insight storytelling is an act of choice. You’re deciding what’s most important in a sea of data, what will actually land with this audience, and what single idea you want them to remember tomorrow.
That’s not easy, especially when you feel responsible for representing the data correctly. Many researchers respond by including everything, just to be safe.
The result is a deck that’s technically thorough but strategically overwhelming.
Storytelling is how insights turn into action
The best insight stories don’t try to say everything. They guide attention.
They start with a clear headline insight, explain why it matters for this audience, and end with what should change as a result. That structure does two critical things at once: it respects the audience’s limited time and it creates momentum toward action.
When structure and audience understanding work together, insights become usable – even when time is tight.
But here’s where many teams get stuck.
Why simplifying your workflow feels so hard
Most research tools are excellent at analysis, but they stop short when it comes to storytelling.
You’re handed raw data files, question-by-question chart decks, and crosstabs. From there, the burden shifts entirely to you.
You have to identify the narrative, decide what to cut, rebuild charts so they’re presentation-ready, design slides that look credible to executives, and adapt the story for different stakeholders, all while trying not to lose the nuance that makes the insight true.
It’s no wonder researchers say they spend more time making decks than doing research.
A simpler way to go from data to story
Imagine if your workflow didn’t start with a blank slide.
Imagine if, instead of asking “How do I turn this into a deck?”, you started with something that already reflected prioritization and narrative.
That’s the problem Suzy built Stories to solve.
Stories are designed to transform research into polished, presentation-ready assets without forcing researchers to become designers or storytellers by trade.
They leverage Suzy’s proprietary AI analysis technology, developed by researchers, to surface insights in formats that are:
- Easy to digest
- Structured around what matters most
- Branded to look and feel like your organization
What Stories actually give you
Stories aren’t just another export. They’re a different starting point.
Instead of beginning with a blank slide or a chart dump, you begin with a narrative that already reflects prioritization and structure. Depending on your needs, Stories give you two core formats.
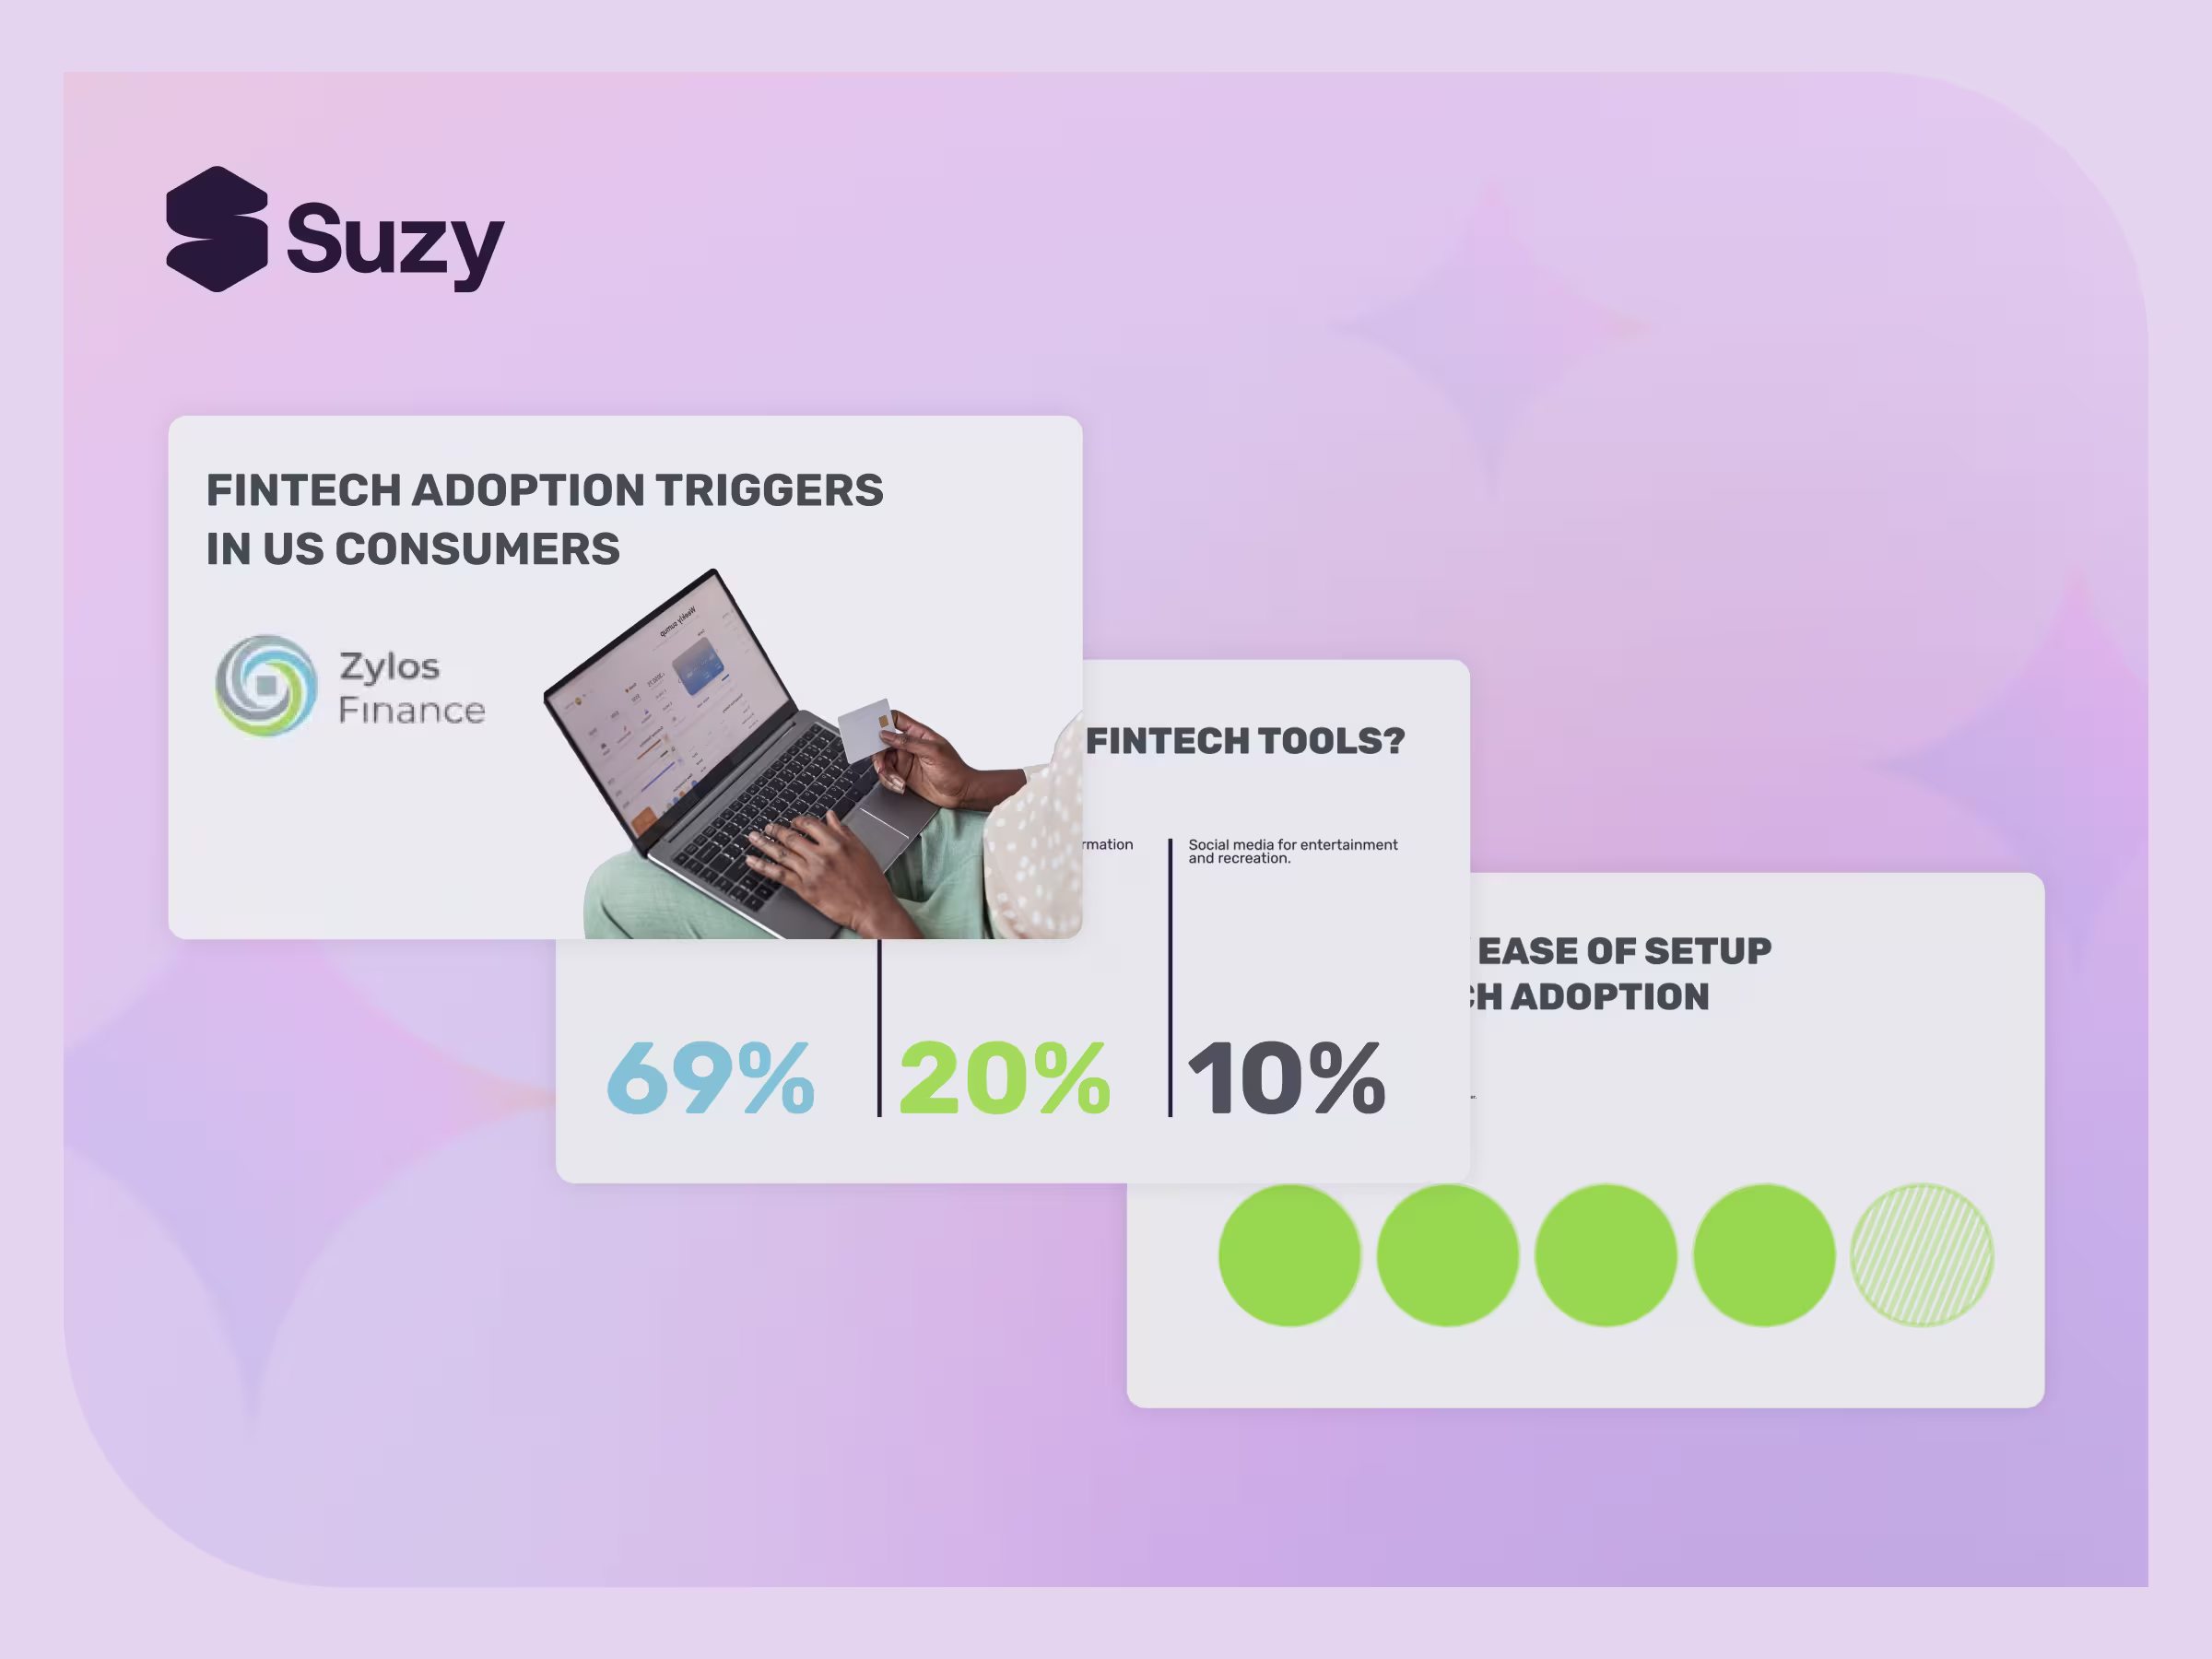
A single-page infographic
This is designed for moments when attention is scarce but impact still matters. The infographic highlights the headline insights and visually emphasizes what’s most important, making it easy to share with executives or circulate across teams.
A robust insights summary deck
For deeper conversations, Stories generate an insights summary deck that’s built for presentation – not analysis for analysis’s sake. It focuses on key themes, what they mean, and where there’s opportunity to act. You still have access to the raw data and detailed results, but you’re no longer forced to start there when telling the story.
How this simplifies your workflow
Stories don’t replace research rigor. They protect it – by ensuring the best insights actually get used.
By starting with a prioritized narrative, researchers can spend less time formatting and more time thinking. You get most of the way to a stakeholder-ready output instantly, without rebuilding decks from scratch for every audience.
Instead of asking, “What if someone wants to see this cut?” the conversation shifts to a more valuable question: “What decision does this insight enable?”
Stories were built for researchers who:
- Struggle to get to the “so what”
- Watch stakeholders zone out during long presentations
- Feel pressure to prove the ROI of their work
- Spend too much time making decks
- Want insights to travel further across the organization
In other words: busy, high-impact research teams who want their work to drive real change.
Insight work shouldn’t end in a slide graveyard
Great research deserves more than a rushed read-through at the end of a meeting.
When insights are clear, prioritized, and designed for how people actually consume information, they have a chance to live beyond the deck – shaping decisions, influencing strategy, and driving outcomes.
Simplifying your workflow isn’t about cutting corners.
It’s about honoring what matters most.
And that’s the story worth telling.
Learn more about how Stories can take your business to the next level.